The GEBCO_2019 Grid
The GEBCO_2019 Grid is the latest global bathymetric product released by the General Bathymetric Chart of the Oceans (GEBCO) and has been developed through the Nippon Foundation-GEBCO Seabed 2030 Project. This is a collaborative project between the Nippon Foundation of Japan and GEBCO. The Seabed 2030 Project aims to bring together all available bathymetric data to produce the definitive map of the world ocean floor and make it available to all.
The Nippon Foundation of Japan is a non-profit philanthropic organisation active around the world. GEBCO is an international group of mapping experts developing a range of bathymetric data sets and data products, operating under the joint auspices of the International Hydrographic Organization (IHO) and UNESCO's Intergovernmental Oceanographic Commission (IOC).
The GEBCO_2019 product provides global coverage, spanning 89° 59' 52.5''N, 179° 59' 52.5''W to 89° 59' 52.5''S, 179° 59' 52.5''E on a 15 arc-second grid. It consists of 86400 rows x 43200 columns, giving 3,732,480,000 data points. The data values are pixel-centre registered i.e. they refer to elevations at the centre of grid cells.
The data are available to download according to the Terms of Use provided in Section 8 below, via several routes including: single-click download of the entire grid in NetCDF format, selection of subsets and creation of output in alternative data formats (see Section 5).
This latest GEBCO product has been developed by the Seabed 2030 data centers, comprised of four Regional Centers and a Global Center.
The Regional Centers are responsible for championing mapping activities; assembling and compiling bathymetric information and collaborating with existing mapping initiatives in their regions. The Global Center is responsible for producing and delivering centralized GEBCO products, such as bathymetric grids.
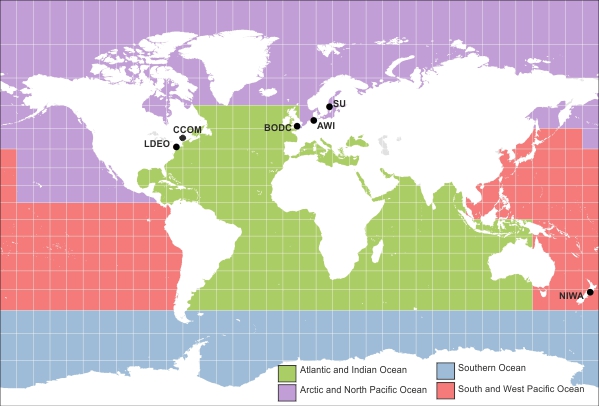
Location of the Seabed 2030 Centers and their areas of responsibility.
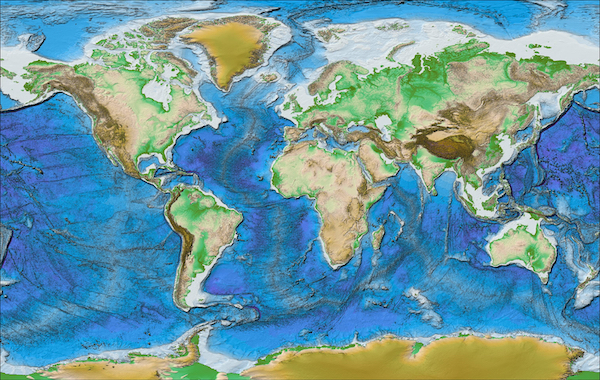
The GEBCO_2019 Grid is a continuous, global terrain model for ocean and land with a spatial resolution of 15 arc seconds.
The grid uses as a 'base' Version 1 of the SRTM15+ data set (Olson et al, 2014). This data set is a fusion of land topography with measured and estimated seafloor topography. It is largely based on version 11 of SRTM30+ (Becker et al, 2009; Sandwell et al, 2014), augmented with the gridded bathymetric data sets developed by the four Seabed 2030 Regional Centers. The published data were recalculated on a cell-registered grid for use by GEBCO.
The Regional Centers have compiled gridded bathymetric data sets, largely based on multibeam data, on a sub-set of the global grid for their areas of responsibility. These regional grids were then provided these to the Global Center. For areas outside of the polar regions (primarily south of 60N and north of 50S), these data sets are in the form of 'sparse grids', i.e. only grid cells that contain data were populated. For the polar regions, complete grids were provided due to the complexities of incorporating data held in polar coordinates.
The compilation of the GEBCO_2019 Grid from these regional data grids, with some additional source data sets, was carried out at the Global Center, with the aim of producing a seamless global terrain model.
The majority of the work, for the non-polar regions, was done using the 'remove-restore' procedure (Smith and Sandwell, 1997; Becker, Sandwell and Smith, 2009 and Hell and Jakobsson, 2011). This is a two stage process of computing the difference between the new data and the 'base' grid, gridding the difference and adding this difference back to the existing 'base' grid. The aim is to achieve a smooth transition between the 'new' and 'base' data sets with the minimum of perturbation of the existing base data set.
For the polar data sets, and the adjoining North Sea area, supplied in the form of complete grids these data sets were included using feather blending techniques from GlobalMapper software version 11.01, made available by Blue Marble Geographic.
The GEBCO_2019 Grid includes data sets from a number of international and national data repositories and regional mapping initiatives. For information on the data sets included in the GEBCO_2019 Grid, please see Section 11 below.
The land data in the GEBCO Grid are taken directly from SRTM15+ for all areas outside the Polar regions.
South of 60°S, the land topography is determined from Bedmap2 (Fretwell et al, 2013).
The GEBCO Grid is accompanied by a Source Identifier (SID) grid. This data set identifies which of the corresponding grid cells in the GEBCO Grid are based on bathymetric soundings or bathymetric depth values from grids and which cells contain predicted or interpolated depth values. Further information about the format and coding of the data set is given below.
The table below details the coding of the GEBCO_2019 Source Identifier (SID) grid.
| SID | Definition |
| 0 | Predicted based on satellite-derived gravity data - depth value is an interpolated value guided by satellite-derived gravity data (from SRTM15_plus) |
| 10 | Singlebeam - depth value collected by a single beam echo-sounder |
| 11 | Multibeam - depth value collected by a multibeam echo-sounder |
| 12 | Seismic - depth value collected by seismic methods |
| 13 | Isolated sounding - depth value that is not part of a regular survey or trackline) |
| 14 | ENC sounding - depth value extracted from an Electronic Navigation Chart (ENC) |
| 15 | Interpolated based on a computer algorithm - depth value is an interpolated value based on a computer algorithm (e.g. Generic Mapping Tools). |
| 16 | Digital bathymetric contours from charts - depth value taken from a bathymetric contour data set |
| 17 | Digital bathymetric contours from ENCs - depth value taken from bathymetric contours from an Electronic Navigation Chart (ENC) |
| 18 | Pre-generated grid - depth value is taken from a pre-generated grid that is based on mixed source data types, e.g. single beam, multibeam, interpolation etc. |
| 19 | Unknown source - depth value from an unknown source |
| 20 | Steering points - depth value used to constrain the grid in areas of poor data coverage |
| 21 | Lidar - depth derived from a bathymetric lidar sensor |
| 22 | Bathymetric sounding - depth value at this location is constrained by bathymetric sounding(s) from the SRTM15_plus data set) |
| 23 | Pre-generated grid - depth value is based on the GEBCO_08 Grid. This data set is a global grid at 30 arc-seconds. It was largely generated from a data base of ship-track soundings with interpolation between soundings guided by satellite-derived gravity data |
| -8888 | Land elevations |
GEBCO's gridded data sets are made available as a global file in CF-netCDF format and for user-defined areas in CF-netCDF, Esri ASCII raster or data GeoTiff.
The complete data set provides global coverage, spanning 89° 59' 52.5''N, 179° 59' 52.5''W to 89° 59' 52.5''S, 179° 59' 52.5''E on a 15 arc-second grid. It consists of 86400 rows x 43200 columns, giving 3,732,480,000 data points. The data values are pixel-centre registered i.e. they refer to elevations at the centre of grid cells.
The gridded data are available to download in a number of different formats as described in the following sections.
A single, global CF-netCDF format file file is available for single-click download.
Within the file, the GEBCO_2019 Grid is stored as a two-dimensional array of 32-bit float values of elevation in metres, with negative values for bathymetric depths and positive values for topographic heights. The netCDF storage is arranged as contiguous latitudinal bands. The total dataset is 12Gb.
The data file includes header information which conforms to the NetCDF Climate and Forecast (CF) Metadata Convention v1.6 (http://cfconventions.org/).
The GEBCO_2019 SID grid is provided in the same array format, but data are stored as a two-dimensional array of 2-byte integers.
This is an ASCII format developed for the export/exchange of Esri ARC/INFO rasters. The format consists of a header that gives the geographic extent and grid interval of the data set, followed by the actual grid cell data values. The GEBCO_2019 Grid and SID grids are made available as single-channel float and integer data values respectively, for user-defined areas, in Esri ASCII raster format using the download tool.
The GeoTiff format contains geo-referencing (geographic extent and projection) information embedded within a Tiff file. The GEBCO_2019 Grid and SID grids are made available as single-channel float and integer data values respectively for user-defined areas in GeoTiff format using the download tool.
GEBCO's global elevation models are generated by the assimilation of heterogeneous data types, assuming all of them to be referred to mean sea level. However, in some shallow water areas, the grids include data from sources having a vertical datum other than mean sea level. We are working to understand how best to fully assimilate these data.
If the data sets are used in a presentation or publication then we ask that you acknowledge the source. This should be of the form:
GEBCO Compilation Group (2019) GEBCO 2019 Grid (doi:10.5285/836f016a-33be-6ddc-e053-6c86abc0788e)
The GEBCO Grid is placed in the public domain and may be used free of charge.
Use of the GEBCO Grid indicates that the user accepts the conditions of use and disclaimer information given below.
While every effort is made to produce an error free grid, some artefacts may still appear in the data set. Please see our errata web page for information on known bugs in the dataset.
If you find any anomalies in the grid then please report them via email (gdacc@seabed2030.org), giving the problem location, and we will investigate.
Olson, C J, Becker, J J and Sandwell, D T (2014). A new global bathymetry map at 15 arcsecond resolution for resolving seafloor fabric: SRTM15_PLUS, AGU Fall Meeting Abstracts 2014.
Becker, J J, D T Sandwell, W H F Smith, J Braud, B Binder, J Depner, D Fabre, J. Factor, S Ingalls, S-H Kim, R Ladner, K Marks, S Nelson, A Pharaoh, R Trimmer, J Von Rosenberg, G Wallace, P Weatherall (2009). Global Bathymetry and Elevation Data at 30 Arc Seconds Resolution: SRTM30_PLUS, Marine Geodesy, 32:4, 355-371.
Sandwell, D T., R D Müller, W H F Smith, E Garcia, R Francis (2014). New global marine gravity model from CryoSat-2 and Jason-1 reveals buried tectonic structure, Science, Vol. 346, no. 6205, pp. 65-67, doi: 10.1126/science.1258213.
Smith, W H F and D T Sandwell (1997). Global seafloor topography from satellite altimetry and ship depth soundings, Science, v. 277, p. 1957-1962, 26 Sept.
Hell, B and M Jakobsson (2011), Gridding heterogeneous bathymetric data sets with stacked continuous curvature splines in tension, Mar. Geophys. Res., 32(4), 493-501, doi:10.1007/s11001-011-9141-1.
Fretwell, P, H D Pritchard D G Vaughan, J L Bamber, N E Barrand, R Bell, C. Bianchi, R G Bingham, D D Blankenship, G Casassa, G Catania, D Callens, H Conway, A J Cook, H F J Corr, D Damaske,V Damm, F Ferraccioli, R Forsberg, S Fujita, Y Gim, P Gogineni, J A Griggs, R C A Hindmarsh, P Holmlund, J W Holt, R W Jacobel, A Jenkins, W Jokat, T Jordan, E C King, J Kohler, W Krabill, M Riger-Kusk, K A Langley, G Leitchenkov, C Leusche, B P Luyendyk, K Matsuoka, J Mouginot,F O Nitsche, Y Nogi, O A Nost, S V Popov, E Rignot, D M Rippin, A Rivera, J Roberts, N Ros,M J Sieger, A M Smith, D Steinhage, M Studinger, B Sun, B K Tinto, B C Welch, D Wilson, D A Young, C Xiangbin and A Zirizzotti (2013). Bedmap2: improved ice bed, surface and thickness datasets for Antarctica, The Cryosphere, 7, 375-393, 2013. doi.org/10.5194/tc-7-375-2013
| Source | Description and Reference |
| Scripps Institution of Oceanography | SRTM15+ v1 Olson, C J, J J Becker and D T Sandwell (2016). SRTM15+: Data fusion of Shuttle Radar Topography Mission (SRTM) land topography with measured and estimated seafloor topography (NCEI Accession 0150537). Data resampled to cell registered format for GEBCO. |
| Alaska Fisheries Science Center of the US National Oceanic and Atmospheric Administration's National Marine Fisheries Service | Bathymetry data from the Alaska bathymetry compilations for the Aleutian Islands, central Gulf of Alaska and Norton Sound. https://www.afsc.noaa.gov/RACE/groundfish/Bathymetry/default.htm |
| Arndt NE Greenland model | Digital bathymetric model of NE Greenland Arndt, J E, W Jokat, B Dorschel, R Myklebust, J A Dowdeswell and J Evans (2015). A new bathymetry of the Northeast Greenland continental shelf: Constraints on glacial and other processes. Geochemistry, Geophysics, Geosystems. 16. doi:10.1002/2015GC005931 |
| Baltic Sea Bathymetry Database (BSBD) team | Baltic Sea Hydrographic Commission (2013). Baltic Sea Bathymetry Database version 0.9.3 Downloaded from: http://data.bshc.pro/ |
| Bureau of Ocean Energy Management (BOEM) | Northern Gulf of Mexico Deepwater Bathymetry Grid from 3D Seismic https://www.boem.gov/Gulf-of-Mexico-Deepwater-Bathymetry/ |
| Canadian Hydrographic Service | Non-Navigational (NONNA-100) Bathymetric Data: represent all currently validated, digital bathymetric sources acquired by CHS, combined at a resolution of approximately 100
metres. Contains information licensed under the Open Government Licence - Canada. https://open.canada.ca/data/en/dataset/d3881c4c-650d-4070-bf9b-1e00aabf0a1d |
| Deep Reef Explorer (www.deepreef.org) | High-resolution depth model for the Great Barrier Reef - 30 Beaman, R J (2018). High-resolution depth model for the Great Barrier Reef - 30 m. Geoscience Australia, Canberra, Australia. http://pid.geoscience.gov.au/dataset/115066 |
| Deep Reef Explorer (www.deepreef.org) | High-resolution depth model for Northern Australia - 100m, V3 Beaman, R J (2010). Project 3D-GBR: A high-resolution depth model for the Great Barrier Reef and Coral Sea. Marine and Tropical Sciences Research Facility (MTSRF) Project 2.5i.1a Final Report, MTSRF, Cairns, Australia, pp. 13 plus Appendix 1 (Internal Report). https://www.deepreef.org/bathymetry/65-3dgbr-bathy.html |
| EMODnet | The EMODnet Digital Bathymetry (DTM) - 2018. A multilayer bathymetric product for Europe's sea basins, based upon more than 9400 bathymetric survey data sets and Composite DTMs gathered from 49 data providers from 24 countries EMODnet Bathymetry Consortium (2018): EMODnet Digital Bathymetry (DTM). http://doi.org/10.12770/18ff0d48-b203-4a65-94a9-5fd8b0ec35f6 |
| Geological Survey of Israel | Hall, J K (2002). Bathymetric compilations of the seas around Israel I: The Caspian and Black Seas. Geological Survey of Israel, Current Research, Vol. 13, December 2002. |
| Geomar | Bathymetric grid for part of the Red Sea region and the South East Pacific region: https://doi.org/10.1594/PANGAEA.860374 and https://doi.org/10.1594/PANGAEA.785515 |
| Geoscience Australia | High-resolution depth model for Northern Australia - 30 m (2018) https://ecat.ga.gov.au/geonetwork/srv/eng/catalog.search#/metadata/121620 |
| Geoscience Australia | 50m Multibeam Dataset of Australia 2012 Wilson, O, C Buchanan and M Spinoccia (2012). 50m Multibeam Dataset of Australia 2012 https://ecat.ga.gov.au/geonetwork/srv/eng/catalog.search#/metadata/73842 |
| Geoscience Australia | Australian Bathymetry and Topography Grid, June 2009 ANZLIC unique identifier: ANZCW0703013116, Geoscience Australia Whiteway, T, (2009). Australian Bathymetry and Topography Grid, June 2009. Scale 1:5000000. Geoscience Australia, Canberra. http://dx.doi.org/10.4225/25/53D99B6581B9A. |
| Geoscience Australia | MH370 - Phase One Data Release http://marine.projects.ga.gov.au/mh370-phase-one-data-release.html |
| Global Multi-resolution Topography Data Synthesis (GMRT) | GMRT version 3.5 A multi-resolutional compilation of edited multibeam sonar data collected by scientists and institutions worldwide, that is reviewed, processed and gridded by the GMRT Team and merged into a single continuously updated compilation of global elevation data, provided at 15 arc sec resolution to GEBCO. https://www.gmrt.org/ |
| Global Sea Mineral Resources NV (GSR), DEME Group, Belgium | Bathymetric grid, based on multibeam data, supplied to GEBCO for a region of the North Pacific, 1,800 km southwest of the Mexican Baja Peninsula. |
| IceBridge BedMachine Greenland | IceBridge BedMachine Greenland, Version 3, -80 - 10°E; 60-90°N: Bed topography/bathymetry map of Greenland based on mass conservation, multi-beam data, and other techniques. Morlighem, M, C N Williams, E Rignot, L An, J E Arndt, J L Bamber, G Catania, N Chauché, J A Dowdeswell, B Dorschel, I Fenty, K Hogan, I Howat, A Hubbard, M Jakobsson, T M Jordan, K K Kjeldsen, R Millan, L Mayer, J Mouginot, B P Y Noël, C O'Cofaigh, S Palmer, S Rysgaard, H Seroussi, M J Siegert, P Slabon, F Straneo, M R van den Broeke, W Weinrebe, M Wood and Zinglersen (2017). BedMachine v3: Complete Bed Topography and Ocean Bathymetry Mapping of Greenland From Multibeam Echo Sounding Combined With Mass Conservation. Geophysical Research Letters 44, 11,051-011,061, doi:10.1002/2017GL074954 http://nsidc.org/data/IDBMG4 |
| International Bathymetric Chart of the Arctic Ocean (IBCAO) | IBCAO v3 bathymetric grid, 180°W-180°E; 64°N-90°N: The grid for the Arctic Ocean area is based on the IBCAO V3 data baseas documented in: Jakobsson, M, L A Mayer, B Coakley, J A Dowdeswell, S Forbes, B Fridman, H Hodnesdal, R Noormets, R Pedersen, M Rebesco, H-W Schenke, Y Zarayskaya, D Accettella, A Armstrong, R M Anderson, P Bienhoff, A Camerlenghi, I Church, M Edwards, J V Gardner, J K Hall, B Hell, O B Hestvik, Y Kristoffersen, C Marcussen, R Mohammad, D Mosher, S V Nghiem, M T Pedrosa, P G Travaglini and P Weatherall (2012). The International Bathymetric Chart of the Arctic Ocean (IBCAO) Version 3.0. Geophysical Research Letters, doi: 10.1029/2012GL052219 |
| International Bathymetric Chart of the Southern Ocean (IBCSO) | IBCSO v1 bathymetric grid, 180°W-180°E; 60S-90°S: The grid for the Southern Ocean area is based on the IBCSO V1 data base as documented in the source id list: https://www.scar.org/science/ibcso/resources/ Arndt, J E, H W Schenke, M Jakobsson, F Nitsche, G Buys, B Goleby, M Rebesco, F Bohoyo, J K Hong, J Black, R Greku, G Udintsev, F Barrios, W Reynoso-Peralta, T Morishita and R Wigley (2013). The International Bathymetric Chart of the Southern Ocean (IBCSO) Version 1.0 - A new bathymetric compilation covering circum-Antarctic waters. Geophysical Research Letters, doi: 10.1002/grl.50413 |
| Israeli Ministry of National Infrastructure, Energy and water Resources | Israel EEZ Hall J K, S Lippman, G Tibor, M Gardosh, A R Sade, H Sade, A Golan, G Amit, L Gur-Arie and I Nissim. A New Bathymetric Map for the Israeli EEZ: Preliminary Results www.energy.gov.il |
| Japan Oceanographic Data Center (JODC) of the Japan Coast Guard | Japan Coast Guard Grid for the North Western Pacific Ocean Provided at 30 arc-second intervals, Tthe grid for this area was originally developed from the following source data:: Multibeam data from the Japan Coast Guard, A pre-prepared 500m interval grid based on measured sounding data: J-EGG500 grid JODC-Expert Grid data for Geographic -500m www.jodc.go.jp/data_set/jodc/jegg_intro.html |
| National Institute of Water and Atmospheric Research Ltd (NIWA), Wellington | New Zealand Bathymetry compilation - 250 m Mitchell, J S, K A Mackay, H L Neil, E J Mackay, A Pallentin and P Notman (2012). Undersea New Zealand, 1:5,000,000. NIWA Chart, Miscellaneous Series No. 92 |
| NOAA Alaskan fisheries | Digitized chart soundings, Alaska Proofed digitized historical chart soundings from 'smooth sheets' covering Alaskan waters. Zimmermann, M, A De Robertis and O Ormseth (2018). Verification of historical smooth sheet bathymetry for the Gulf of Alaska - Integrated Ecosystem Research Program. Deep Sea Research Part II: Topical Studies in Oceanography. doi:10.1016/j.dsr2.2018.06.006. Zimmermann, M and M Prescott (2018). Bathymetry and Canyons of the Eastern Bering Sea Slope. Geosciences. 8. 184. doi:10.3390/geosciences8050184. https://noaa.maps.arcgis.com/home/item.html?id=c41002831ed34ce0b63727ed7d3636cc |
| Norwegian Hydrographic Service (NHS) | Svalbard bathymetry grid Released in 2016, this dataset includes modern multibeam data from surveys up until autumn 2015. Data is gridded to 10x10 m. https://www.kartverket.no/ |
| Norwegian Polar Institute (NPI) | Svalbard topography grid New topographical data of Svalbard with updated glacial fronts from satellite imaging. https://toposvalbard.npolar.no/ http://www.npolar.no/no/ |
| Nunaoil A/S | New bathymetry models in Baffin Bay, Northeast and Western Greenland. http://nunaoil.gl/ |
| Olex AS, Norway (www.olex.no) | Data supplied to GEBCO for: areas of the North Atlantic off the west coast of Africa areas of the Northwest European Continental Shelf in the Arctic Ocean area |
| Service Hydrographique et Océanographique de la Marine (shom), France | Bathymetric data supplied in the form of grids, largely from multibeam and Lidar bathymetric surveys and transect cruises in areas of the Pacific, Atlantic and Indian Oceans, from the data
holdings and cruises of shom https://data.shom.fr/ |
| South West Indian Ocean Bathymetry Compilation (SWIOBC) | Dorschel, B, L Jensen, J E Arndt, G-J Brummer, H de Haas, A Fielies, D Franke, W Jokat, R Krocker, D Kroon, J Pätzold, R R. Schneider, V Spieß, H Stollhofen, G Uenzelmann-Neben,
M Watkeys and E Wiles (2018). The Southwest Indian Ocean Bathymetric Compilation (SwIOBC). Geochemistry, Geophysics, Geosystems 19, no. 3 (March 2018): 968-76. https://doi.org/10.1002/2017GC007274 |
| University of Alaska Fairbanks and its College of Fisheries and Ocean Sciences | Alaska Region Digital Elevation Model (ARDEM) Version 2.0. Danielson, S L, E L Dobbins, M Jakobsson, M A Johnson, T J Weingartner, W J Williams and Y Zarayskaya (2015), Sounding the northern seas, Eos, 96, doi:10.1029/2015EO040975 |
| University of New Hampshire Center for Coastal and Ocean Mapping/Joint Hydrographic Center (UNH/CCOM-JHC) | United States Atlantic Law of the sea bathymetric grid, version 2017 https://ccom.unh.edu/theme/law-sea/law-of-the-sea-data/atlantic |
| US-Extended Continental Shelf (ECS) cruises |
Cruise data in:
|
| Source | Description and Reference |
| IHO DCDB | Bathymetric Soundings extracted from the data maintained by the International Hydrographic Organization (IHO) Data Center for Digital Bathymetry (DCDB) at the US National Centers for
Environmental Information (NCEI). https://www.ngdc.noaa.gov/iho/ |
| Alfred Wegener Institute (AWI) | 81 Cruises of Multibeam data in the Atlantic and Indian Ocean region. 11 Cruises of multibeam data in the South and West Pacific: https://www.awi.de/en/ |
| British Antarctic Survey (BAS) | Multibeam data from three cruises of the RRS James Clark Ross. https://www.bas.ac.uk/ |
| Fugro | 8 Cruises of Multibeam data in the Atlantic and Indian Ocean region. |
| Dufek (Sonne) | 2 cruises in the Atlantic Ocean. |
| Geological Institute, Russian Academy of Sciences (GIN RAS) | Knipovich Ridge Multibeam data from four surveys with RV Akademik Nikolaj Strakhov of the Knipovich Ridge. Updated since IBCAO v3 with higher resolution. Zayonchek A V, H Brekke, S Yu. Sokolov, A O Mazarovich, K O Dobrolyubova, V N Efimov, A S Abramova, Yu A Zaraiskaya, A V Kokhan, E A Moroz, A A Peive, N P Chamov and K P Yampol'skii (2010). The Structure of Continent-Ocean transition zone at North-West Barents Sea Margin (results of 24-26-th cruises of RV 'Akademik Nikolaj Strakhov', 2006-2009) - Structure and evolution of the Lithosphere. Contribution of Russia to International Polar Year. Vol.4. M Paulsen. pp.111-157. http://atlantic.ginras.ru/download/exp/grd/grd_data.html |
| Greenland Institute of Natural Resources | Crowd source data and multibeam data from Weinrebe Poseidon cruise. http://www.natur.gl/en/ |
| Indian Ocean Bathymetric Compilation | 102 Cruises of Multibeam data in the Atlantic and Indian Ocean region. |
| Irish Marine Institute | 3 Cruises of Multibeam data in the Atlantic and Indian Ocean region. |
| Japan Agency for Marine-Earth Science and Technology (JAMSTEC) | 22 cruises of MBES data in the South and West Pacific Ocean region Data and Sample Research System for Whole Cruise Information in JAMSTEC http://www.godac.jamstec.go.jp/darwin/e |
| Korea Polar Research Institute (KOPRI) | Multibeam data from Araon cruise ARA02B. https://eng.kopri.re.kr/ |
| MARUM - Center for Marine Environmental Sciences, University of Bremen | Multibeam data from two cruises of the RV Heincke. https://www.marum.de/en/index.html |
| NASA-OMG | Multibeam mapping carried out by the Ocean Melting Greenland Project (OMG). Fenty, I, J K Willis, A Khazendar, S Dinardo, R Forsberg, I Fukumori, D Holland, M Jakobsson, D Moller, J Morison, A Münchow, E Rignot, M Schodlok, A F Thompson, K Tinto, M Rutherford and N Trenholm (2016). Oceans Melting Greenland: Early results from NASA's ocean-ice mission in Greenland. Oceanography 29(4):72-83, https://doi.org/10.5670/oceanog.2016.100. https://omg.jpl.nasa.gov/portal/ |
| OET-Nautilus | US Non - ECS Nautilus west coast cruises 20 Cruises of Multibeam data in the North Pacific. https://nautiluslive.org/expedition-map |
| Stockholm University, Geological Sciences | Multibeam data from icebreaker Oden expeditions, e.g. Petermann 2015, SWERUS-C3 2014 and LOMROG 2012. Also included is the Vega expedition in 2013, with Explorer of Sweden. https://www.su.se/geo/english/ Oden Mapping data: https://oden.geo.su.se/ |
| TelePost Greenland A/S | Multibeam data from South Greenland on the RV OGS Explora. https://telepost.gl/ |
| The University Centre in Svalbard (UNIS) | Multibeam data from Svalbard, from four cruises on the RV Helmer Hanssen. https://www.unis.no/ |
| University of New Hampshire, Center for Coastal and Ocean Mapping, Joint Hydrography Centre (UNH/CCOM-JHC) | 10 Cruises of Multibeam data in the North Pacific and the HLY1202 Arctic cruise. Multibeam data from cruise HLY1202 with icebreaker Healy. https://ccom.unh.edu/sites/default/files/publications/HEALY1202_FINAL_CRUISE REPORT.pdf |
| Source | Description and Reference |
| Member States of the International Hydrographic Organization (IHO) | Bathymetric soundings extracted from Electronic Navigation Charts (ENCs) provided by IHO Member States. Access further details about ENC contributions made to GEBCO. www.gebco.net/data_and_products/gridded_bathymetry_data/shallow_water_bathymetry |
| Geological Survey of Denmark and Greenland (GEUS) | Singlebeam data from BB2012, Baffin Bay, Greenland. https://eng.geus.dk/ |
| National Geospatial-Intelligence Agency (NGA) | Singlebeam data in Melville Bay, Greenland. |
| South African Navy Hydrographic Office | ENC data for South African Waters |
| US Navy | Singlebeam data in Arctic region from US Navy submarines USS New Hampshire, USS Connecticut and USS Topeka. https://www.navy.mil/ |